Case DECOCLEAN, Gladenbach, Germany
34% More Productivity with Laundry Dashboard
“We originally expected a payback period of four years; now it is just twelve months.”
Case Gunderson, Menasha, Winconsin, United States
A productivity increase of 33%
“The ROI is less than a year, making Laundry Dashboard a no-brainer for every laundry.”

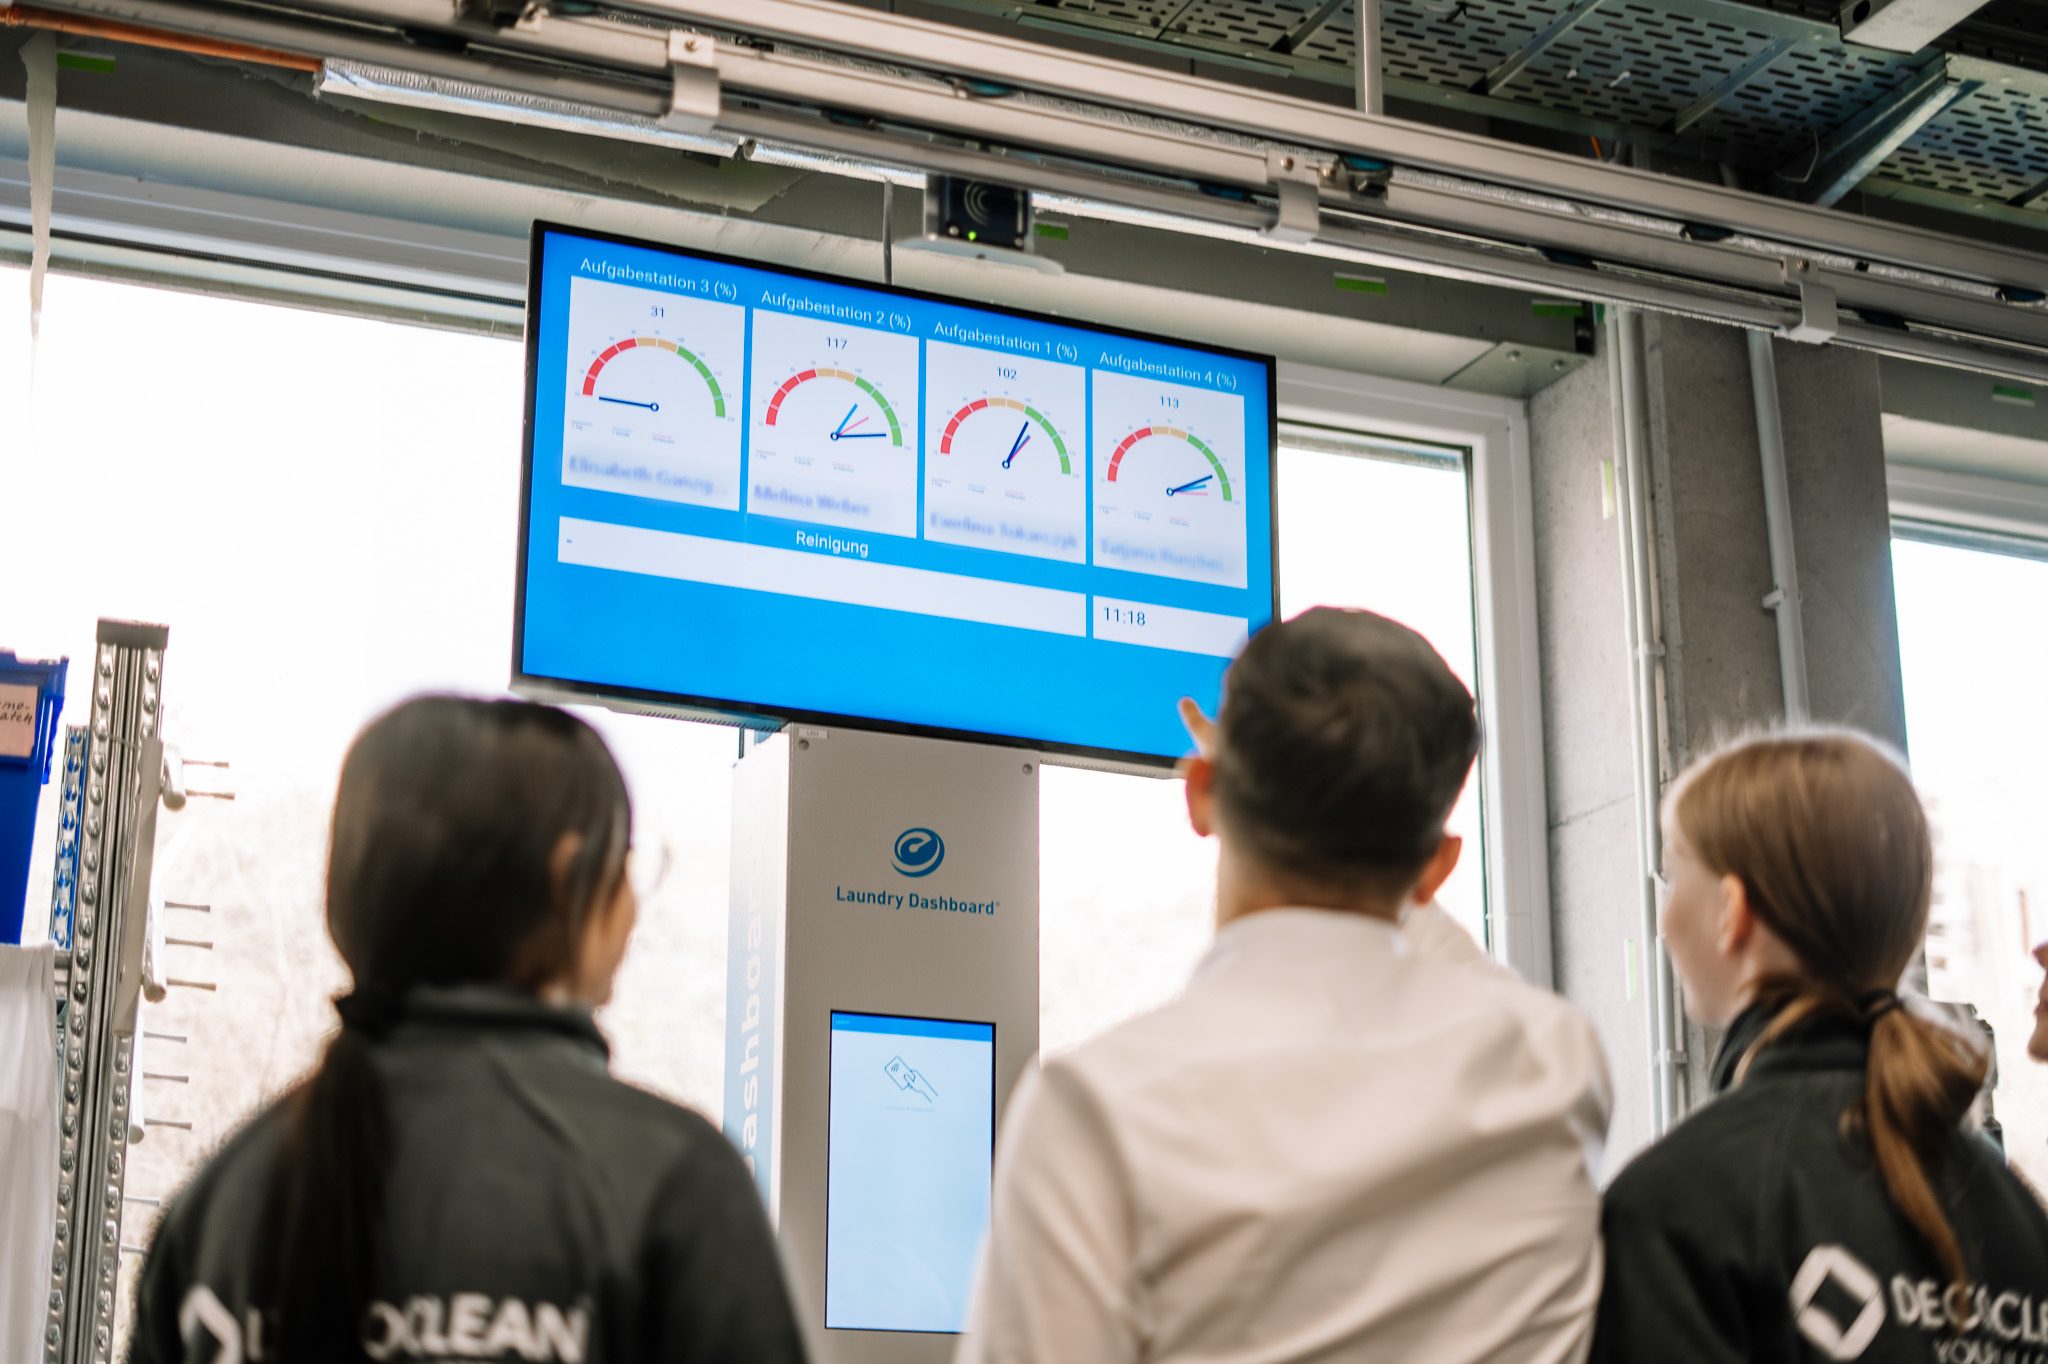
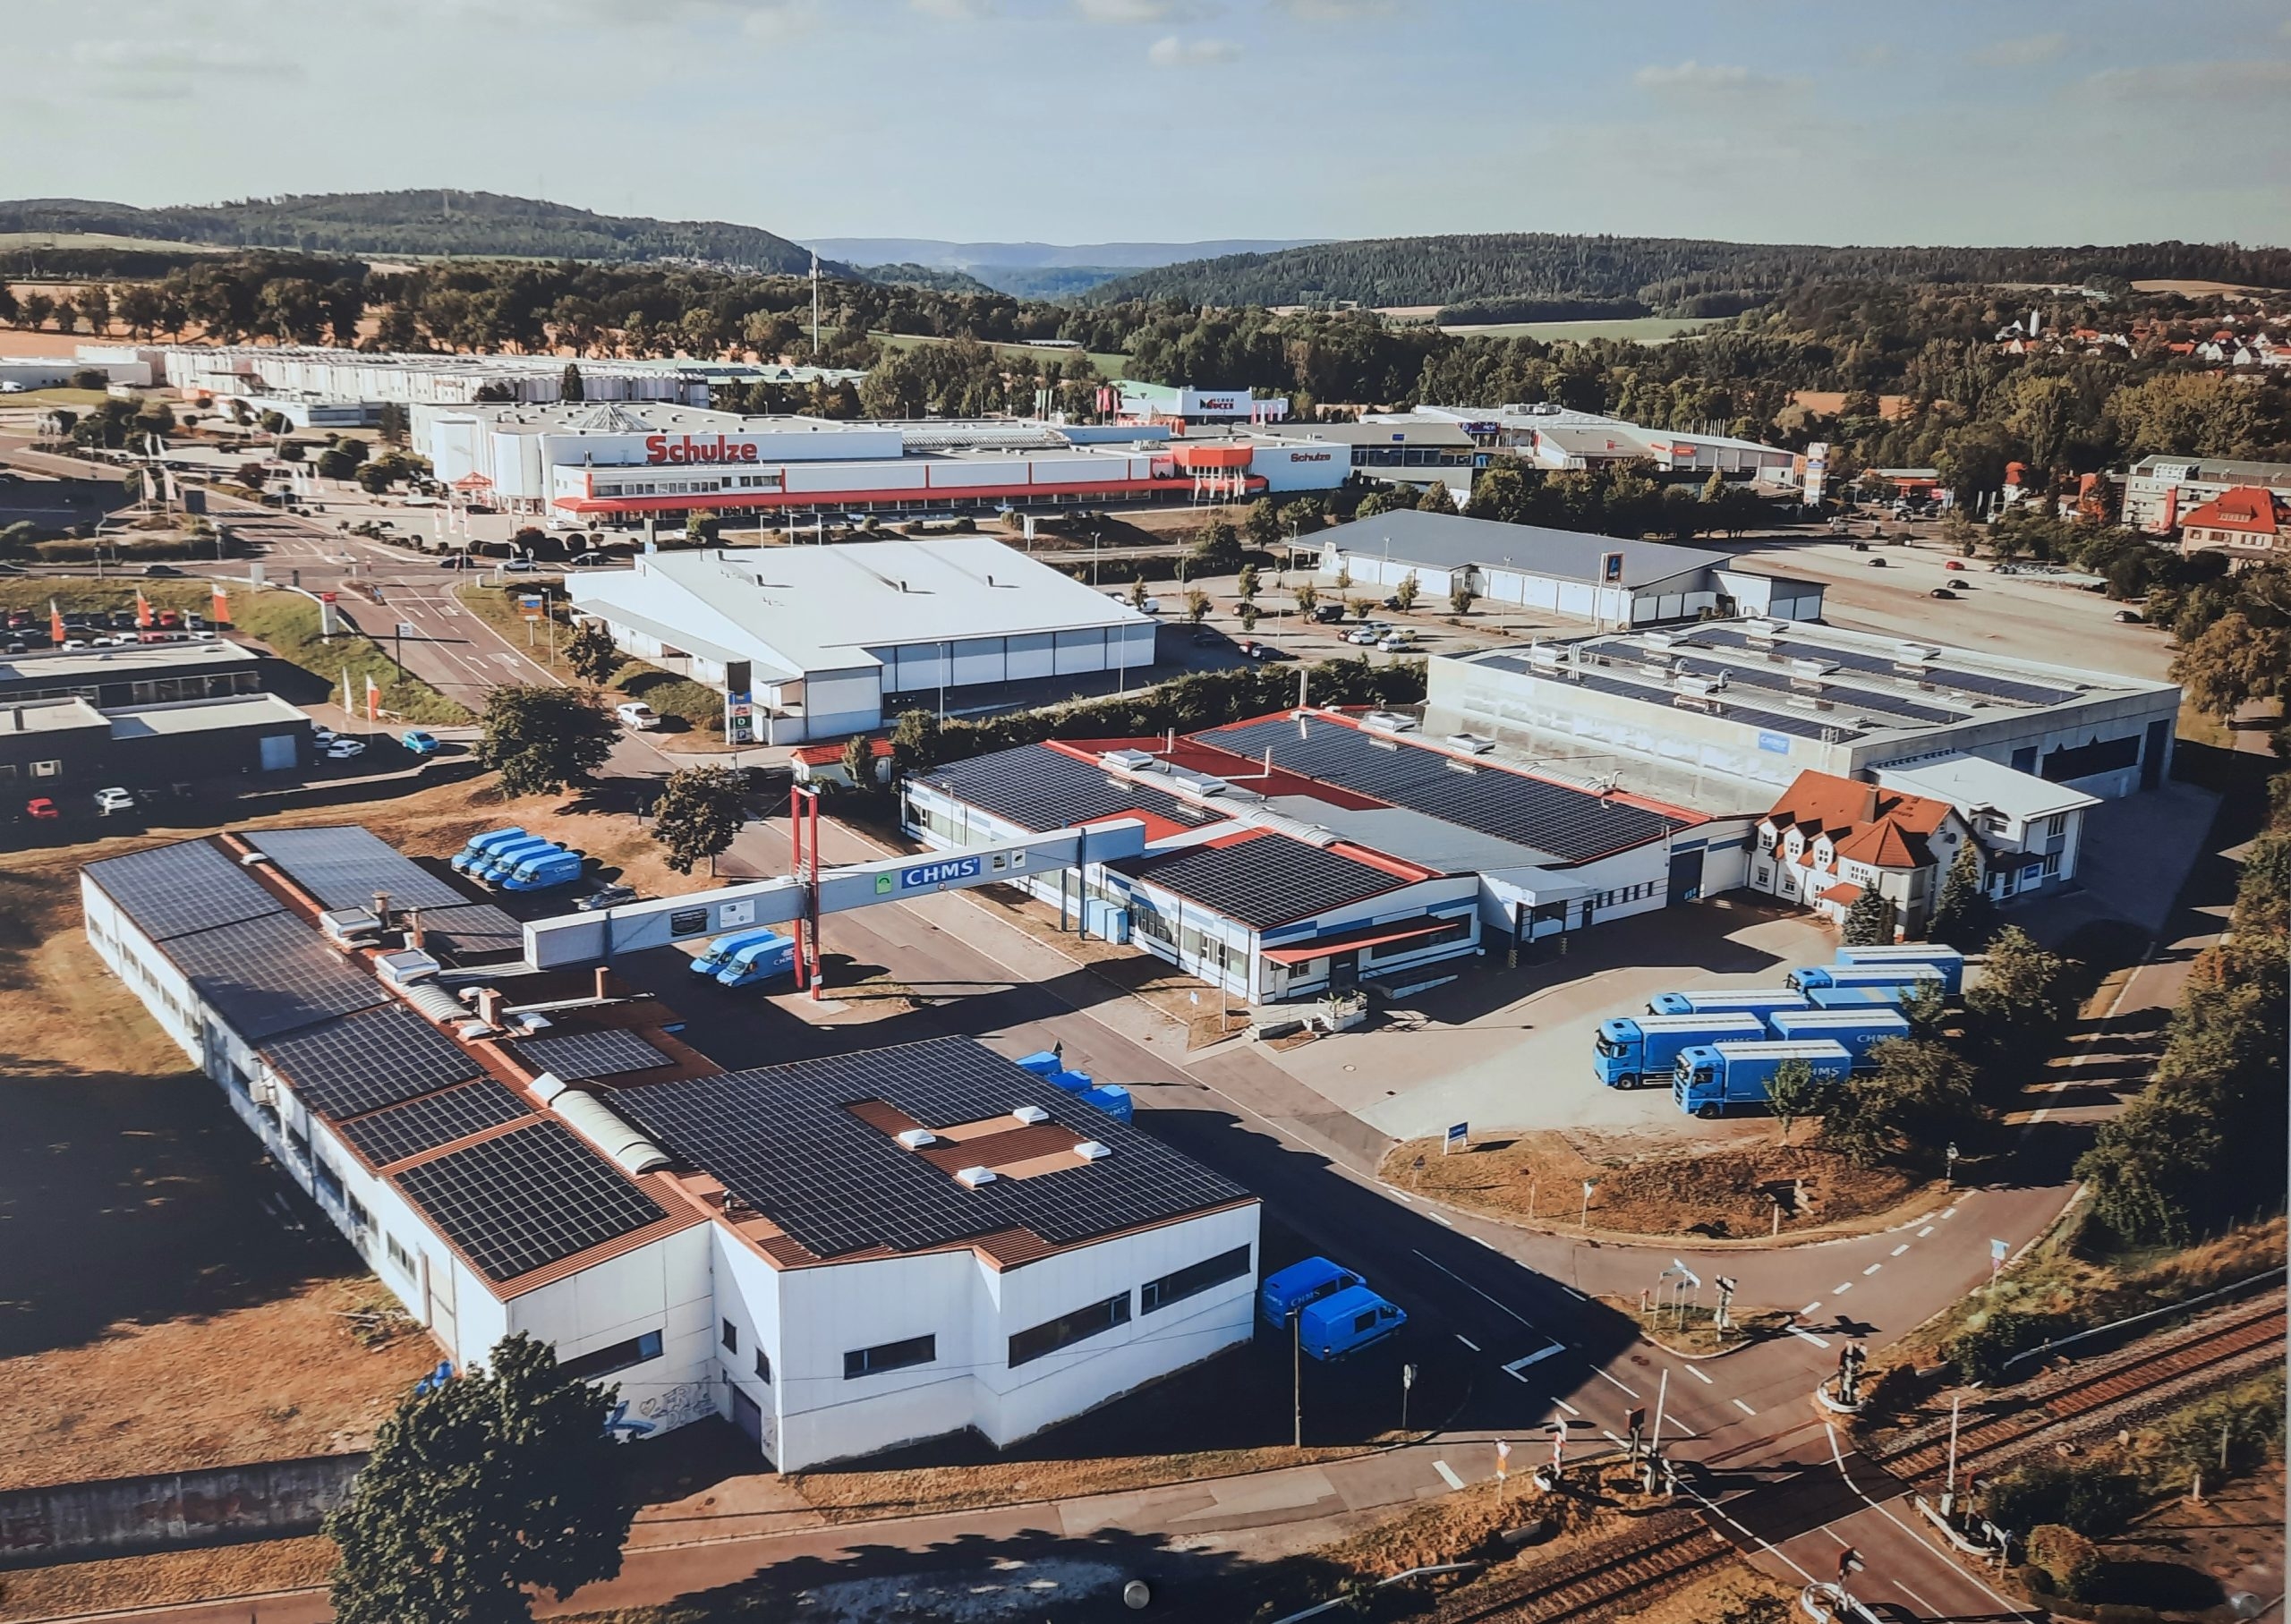
Case CHMS (Coburger Handtuch & Matten Service), Germany
Up to 5% performance increase in the first month
‘Thanks to Laundry Dashboard, we have a better understanding of how much capacity we currently have and how much we will need next year.’
Case Göddecke Textilpflege Olsberg, Germany
15% increase in productivity in the PG laundry.
‘In the past, we only believed that we had become better. Today we know that we have really increased performance by 10 to 15 per cent through this data.’

Centralvaskeriet Løgumkloster, Denmark
Linen production increased with up to 30%.
‘You can certainly have a look around the laundry, and think that everyone is hard at work– or not, but that is a single impression. It’s not something you can rely on. What you need is a tool to monitor and measure these things.’

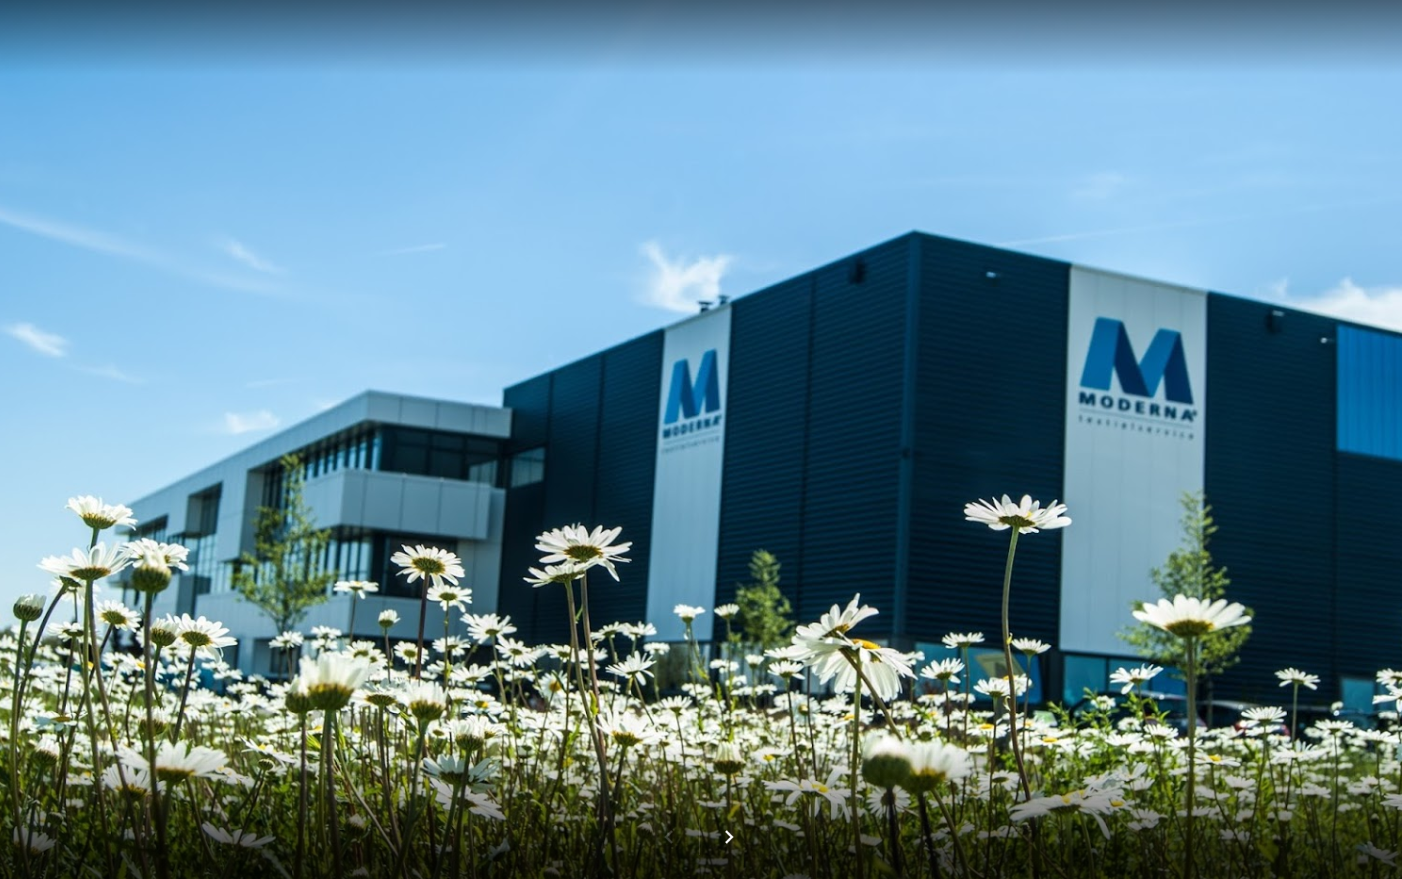
Moderna Textielservice Hardenberg, Netherlands
Gas savings of 10% in the hospitality laundry
Laundry Dashboard creates insight into labour capacity, machine performance, and consumption efficiency. Based on this data, Moderna was able to optimise its energy consumption, and to save a considerable amount of time on the drying machines.
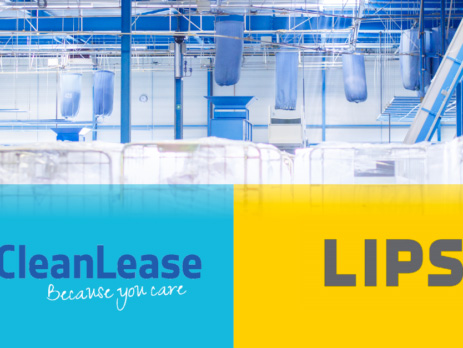
Cleanlease Goes, Netherlands
Productivity gains of 4% promised, 15% realized.
The main reason for CleanLease Goes to use Laundry Dashboard is to take the performance of the laundry to a higher level. This is reflected in a piece of insight into machine performance, departmental performance and employee performance.
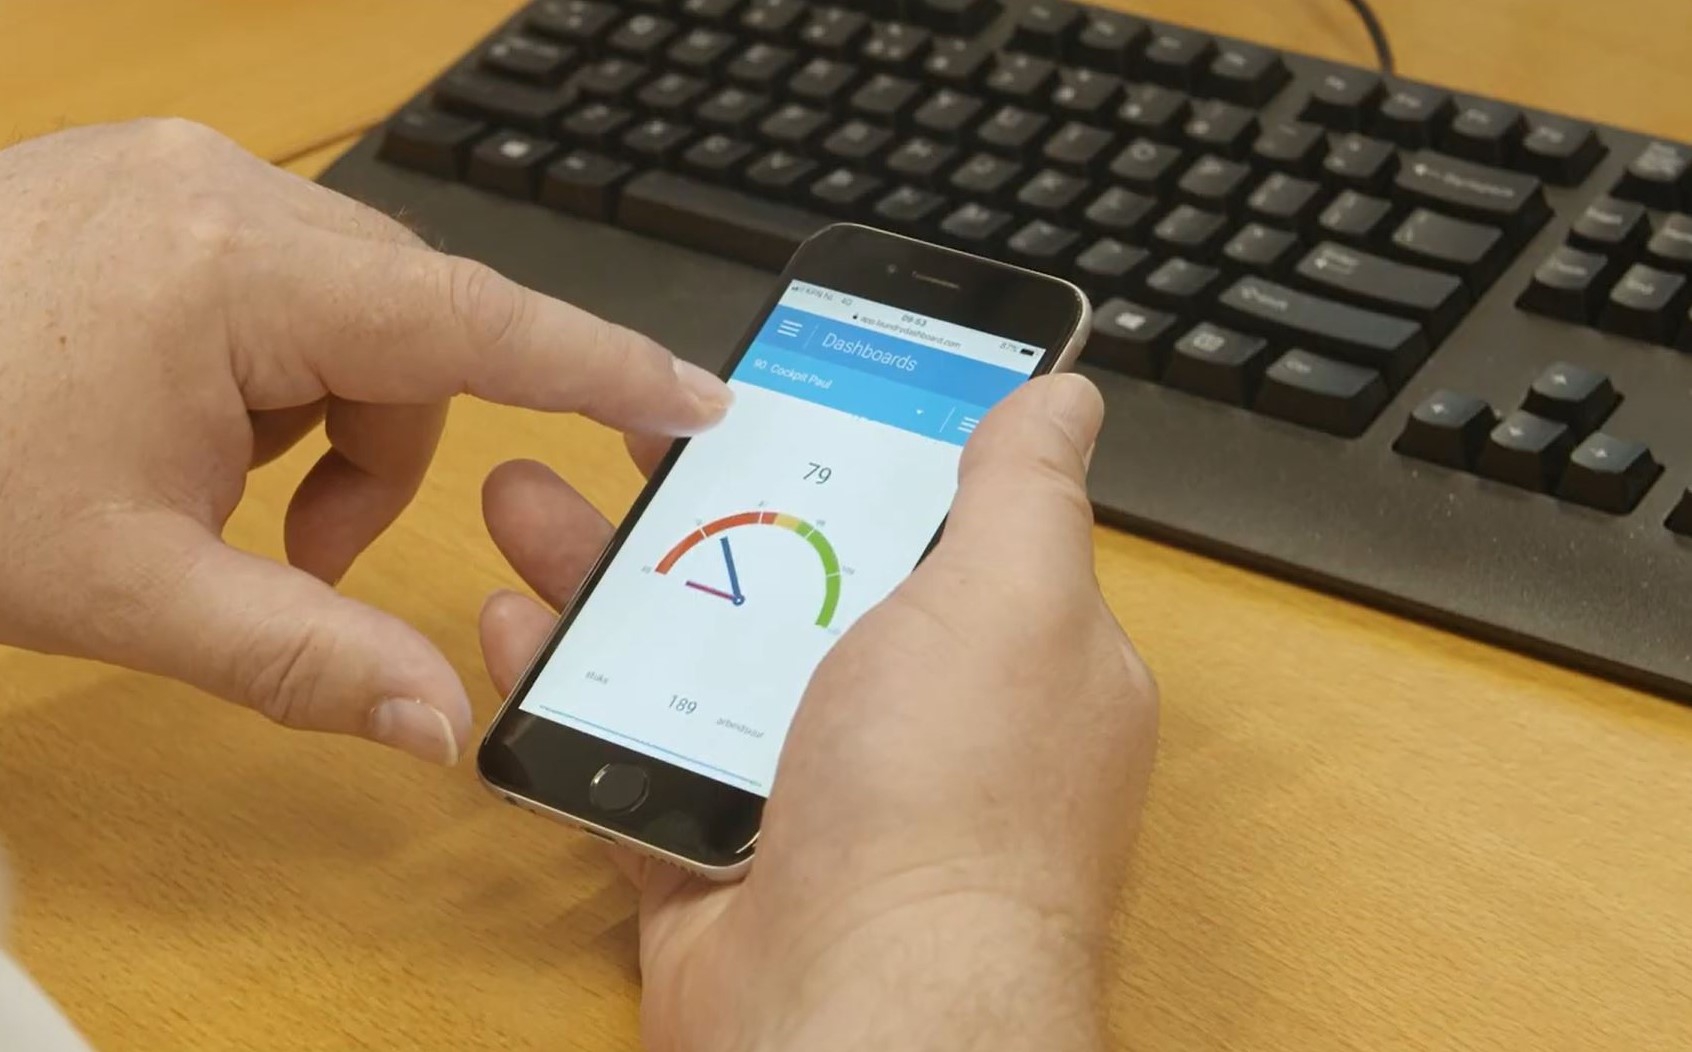
Cleanlease Eindhoven, Netherlands
Higher financial returns, higher customer satisfaction.
The reasons for CleanLease Eindhoven to purchase Laundry Dashboard were, on the one hand, to want higher productivity and, on the other hand, to want to have a more objective system to monitor the performance of the employees.